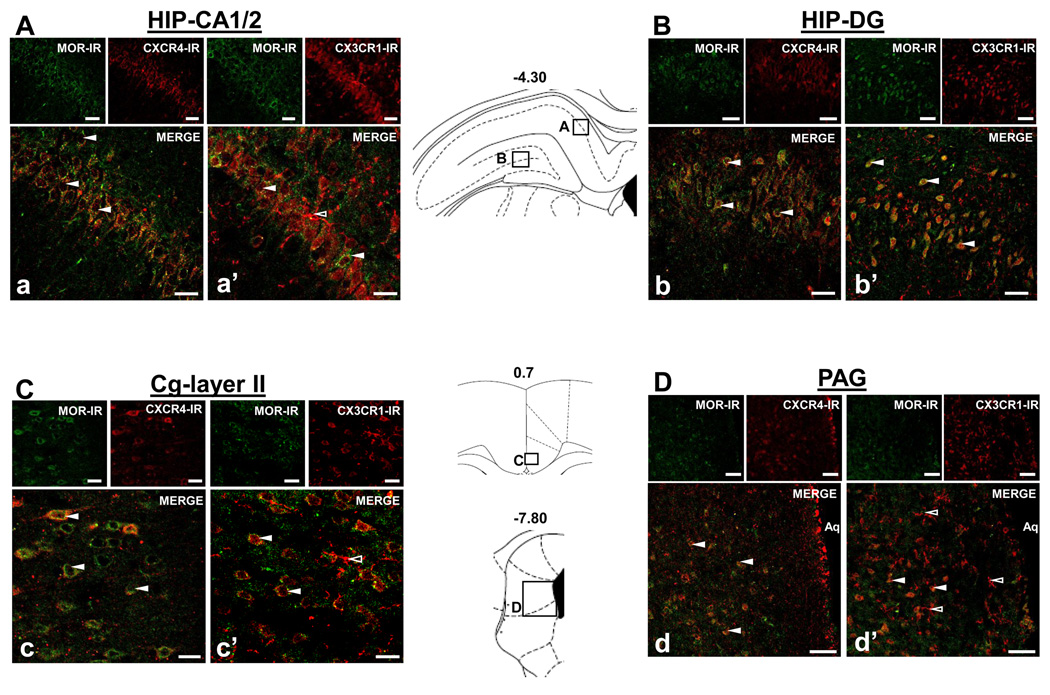
Figure 2. Colocalization of CXCR4-MOR and CX3CR1-MOR in hippocampus (HIP), cingulate cortex (Cg), and periaqueductal grey (PAG).
Fluorescent photomicrographs of MOR- with CXCR4- or CX3CR1- containing cells in coronal sections (30 µm) through the HIP CA1/2 and dentate gyrus (DG) (Aa, a’; Bb, b’), Cg (Cc, c’), and PAG (Dd, d’). In each brain region examined, the upper left panels show MOR-immunoreactivity (IR) in green, the upper right panels show CXCR4-IR or CX3CR1-IR in red, and the large panel illustrates the merge image with numerous colocalized cells (solid white arrows A–D). CX3CR1-IR was also single-labeled on cells morphologically similar to microglia (outlined white arrows, a’; c’; d’). Schematics from Paxinos and Watson (2005) are included to indicate the locations of the panels within their respective brain regions. Scale Bars: 50 µm.

