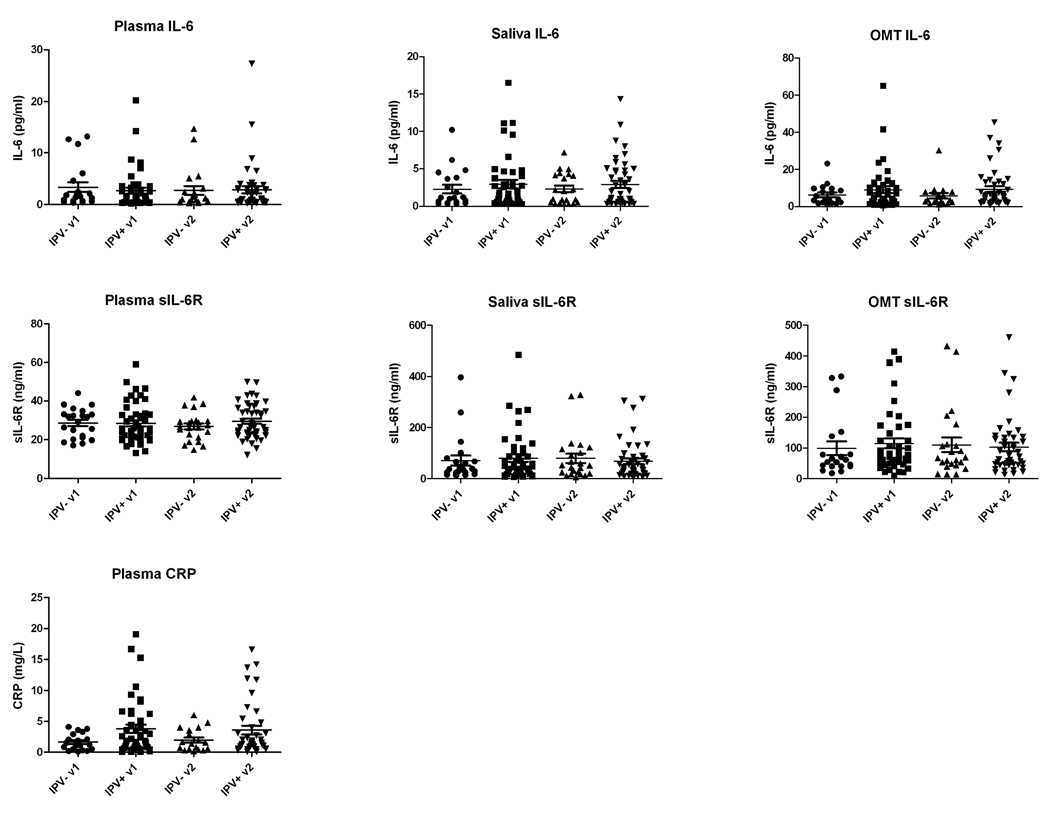
Figure 1. Distribution of the levels of IL-6, sIL-6R and CRP in plasma, saliva and OMT samples.
Plasma, saliva and OMT samples collected during visits 1 and 2 were assayed for IL-6 and sIL-6R by ELISA and for CRP by turbidimetry. Figure shows the individual values for the IPV− (control) and IPV+ groups on visits 1 (v1) and 2 (v2). In the case of saliva and OMT, the average values of determinations for samples A and B (before and after completion of the psychological questionnaires) were used. The horizontal bar shows the mean and S.E.M. (n=21 for the IPVand n=46 for the IPV+ group).

