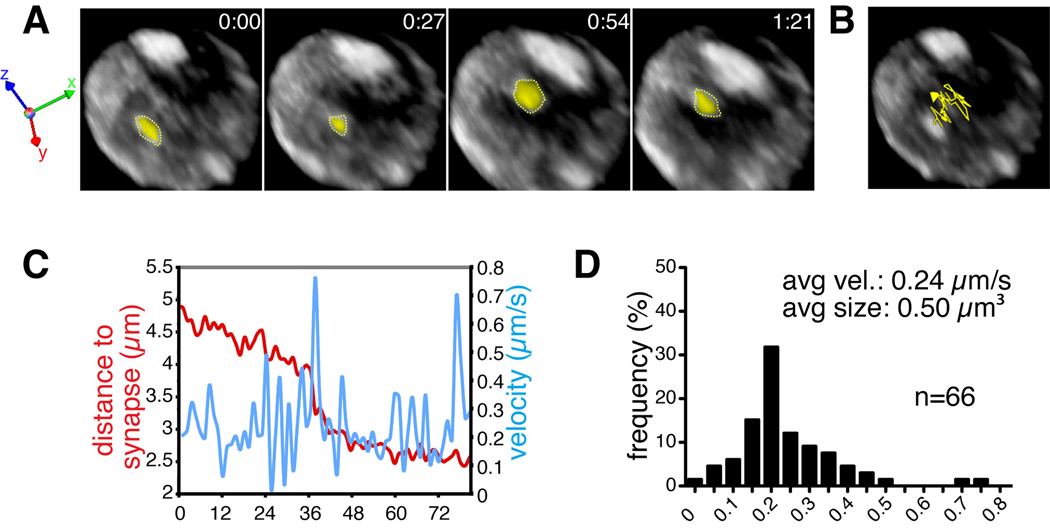
Fig. 3. Tracking puncta of HIV Gag-iGFP at the virological synapse.
HIV Gag-iGFP transfected Jurkat T cells and cmtmr-labeled primary CD4+ T cells were mixed and loaded into Ibidi chambers. Live cell imaging was performed with a spinning disk confocal microscope using methodology described in the text. (A) Volocity software was used to track the movement of Gag puncta moving towards a virological synapse. (B) A tracing of the movement of the Gag-iGFP puncta is shown over time. (C) Manual tracking was used to generate a measurement file that enabled one to calculate the position (with respect to the synapse) and velocity of the particle in microns/second. (D) Distribution of velocities of the object can be plotted to show the frequency with which the object moves at a given speed.

