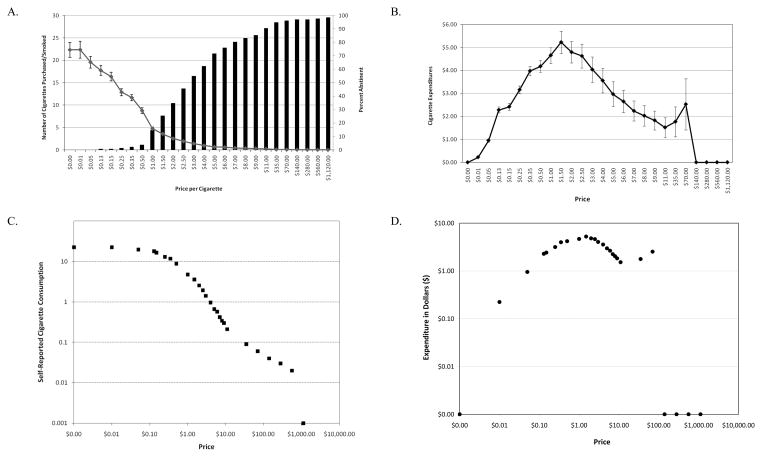
Figure 1.
Panel A depicts the mean number of cigarettes that participants reported that they would smoke at 26 different prices (left axis), as well as the percentage of the sample that reported they would abstain at each price (right axis). Error bars represent +/− 1 Standard Error of the Mean (SEM). As expected, cigarette smoking exhibited a decelerating trend in response to price increases. Abstinence rates were extremely low at prices up to $1 per cigarette. The sample abstinence rate first exceeded 50% at a price of $3 per cigarette (55% abstinent) and increased rapidly thereafter. Panel B depicts response output (mean cigarette expenditures, computed as reported cigarette consumption x cigarette price). Error bars represent +/− 1 SEM. Response output conformed to an inverted U-shaped function up to the point where the extremely large prices resulted in high mean expenditure values despite the fact that most participants had reached breakpoint. Panels C and D also depict demand and expenditure curves plotted in conventional double logarithmic coordinates for proportionality.

