
Fig. 6.
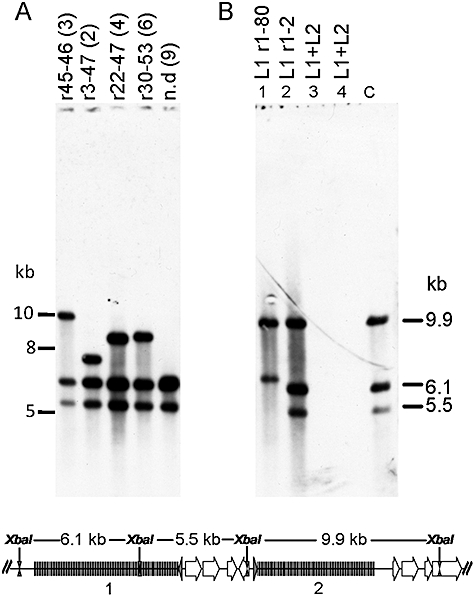
Southern blot analysis of CRISPR locus deletions of S. islandicus REY15A transformants where sample C denotes a control sample of S. islandicus REY15A. The deleted regions determined by sequencing are indicated above each well.
A. Analysis of deletions in locus 2 determined from the PCR products shown Fig. 5A where the numbers in the brackets correspond to the sample numbers on agarose gel.
B. Samples correspond to the PCR products illustrated in Fig. 7A and B. Tracks 1 and 2 carry transformants 1 and 2 while tracks 3 and 4 carry transformants with protospacers matching both spacer 20 of locus 1 and spacer 45 of locus 2 (Table 5).
The lower diagram shows the restriction sites in the CRISPR region where the expected DNA fragment sizes are indicated.