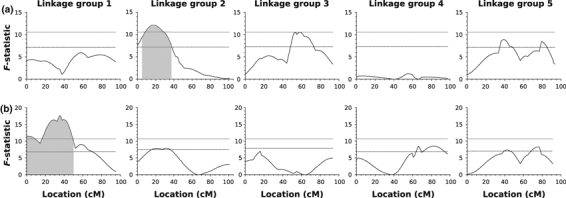
Fig. 3.

Locations of (a) sex ratio and (b) clutch size quantitative trait locus (QTL) in Nasonia vitripennis. F-statistic obtained by regressing genotype against sex ratio or clutch size. The grey, solid line is the 5% genome-wide significance threshold from permutation tests, and the black, dashed line is the 5% chromosome-wide significance threshold. The shaded region is the 95% confidence interval for the two QTL significant at the genome-wide level (obtained by bootstrapping; see main text for details).
