
Figure 4.
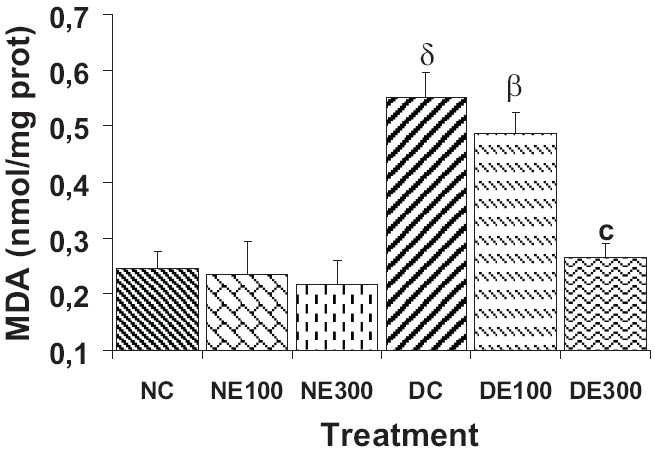
Lipid peroxidation* in mice liver after 15 days of treatment (once daily) with Terminalia glaucescens leaf extract
*Expressed as malondialdehyde, MDA, concentration: nmol/mg of protein)
Data are mean ± SEM, (n = 8 per group). Significant difference: βP < 0.01, δP < 0.001 compared with NC values; cP < 0.001 compared with DC values