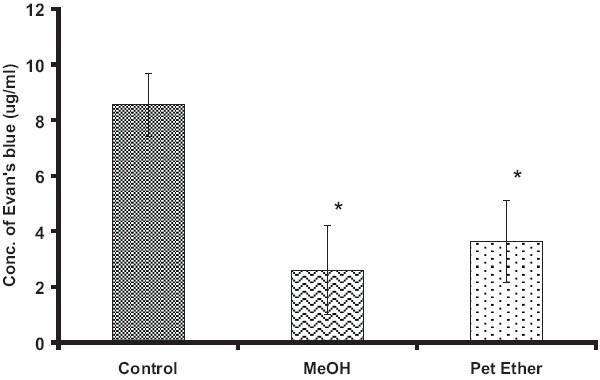
Figure 1.

Effect of Benincasa hispida on ethanol-induced vascular permeability.
All values represent Mean ± SEM, n = 6 in each group.
*P < 0.05, when compared with the control group (ANOVA, followed by Tukey's multiple range test)

Effect of Benincasa hispida on ethanol-induced vascular permeability.
All values represent Mean ± SEM, n = 6 in each group.
*P < 0.05, when compared with the control group (ANOVA, followed by Tukey's multiple range test)