Figure 3.

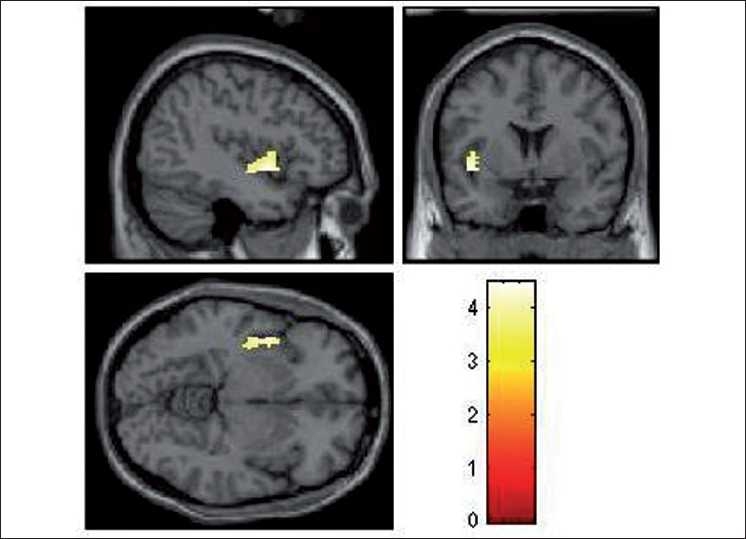
Rendered images depicting the significantly deficient activation in left insula in HR subjects (n=17) in comparison to LR subjects (n=16). The color bar is representative of the “T” scores given in Table 2

Rendered images depicting the significantly deficient activation in left insula in HR subjects (n=17) in comparison to LR subjects (n=16). The color bar is representative of the “T” scores given in Table 2