
Figure 5.
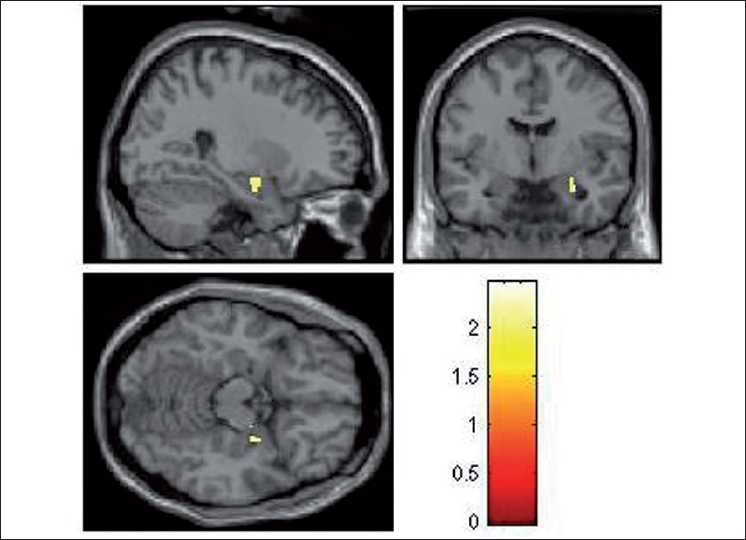
Rendered images depicting the significantly deficient activation in right amygdala in HR subjects (n=17) in comparison to LR subjects (n=16). The color bar is representative of the “T” score
Official websites use .gov
A
.gov website belongs to an official
government organization in the United States.
Secure .gov websites use HTTPS
A lock (
) or https:// means you've safely
connected to the .gov website. Share sensitive
information only on official, secure websites.
Rendered images depicting the significantly deficient activation in right amygdala in HR subjects (n=17) in comparison to LR subjects (n=16). The color bar is representative of the “T” score