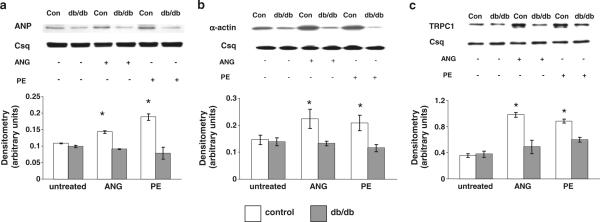
Fig. 1.
Expression of a ANP, b α-actin and c TRPC1 protein in cardiomyocytes isolated from non-diabetic control (control) and diabetic (db/db) hearts following 24 h treatment with ANG (1 μM) or PE (10 μM). Upper panels are representative immunoblots and the lower panels are mean densitometric data from three individual experiments normalized to calsequestrin. *P < 0.05 versus control untreated group

