
Figure 1.
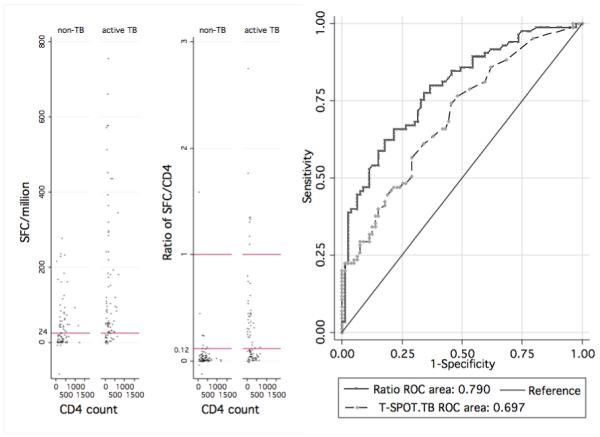
A (left) shows scatter plots of SFC/CD4 ratio and T-SPOT.TB quantitative data. At the manufacturer’s cut-off of 24 SFC/million, the T-SPOT.TB test was noted to have a high proportion of positive results compared to the SFC/CD4 ratio in the non-TB group (figure 1A-left panel). The right panel of figure 1A highlights an increase in sensitivity in distinguishing active disease from latent infection when the cut-off for the SFC/CD4 is lowered from 1 to 0.12. Reference horizontal lines show cut-off values at the manufacturer’s cut-off for the T-SPOT.TB (left panel) and at a ratio of 0.12 and 1 (right panel); spots above reference lines test positive using T-SPOT.TB and SFC/CD4 ratio tests respectively.
B (right) shows ROC curves of T-SPOT.TB and SFC/CD4 ratio showing Area Under the Curve (AUC) values