
Figure 3.
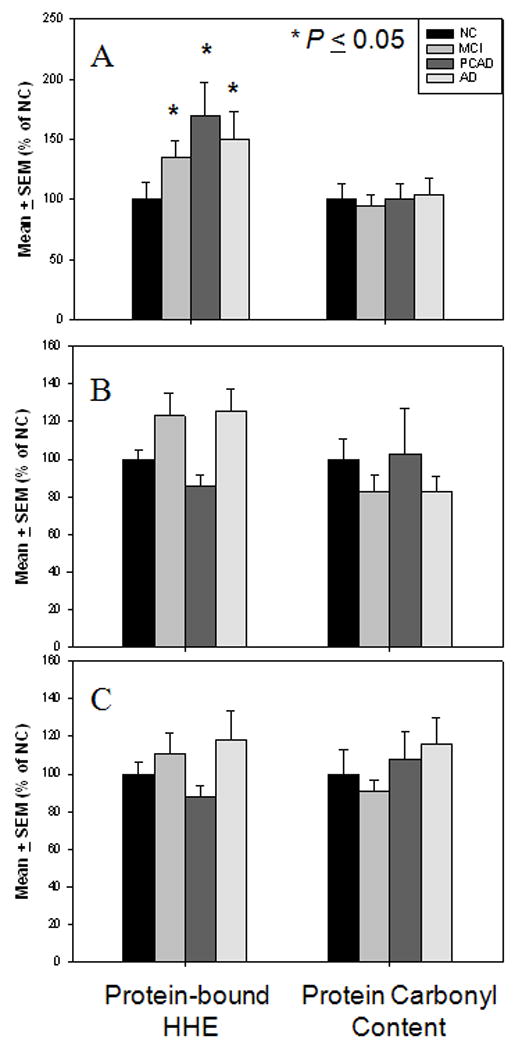
Levels of protein-bound HHE and protein carbonyl content expressed as mean ± SEM (% NC). (A) Levels of protein-bound HHE and protein carbonyl content in HPG of NC, MCI, PCAD, and LAD subjects. There was a significant (P ≤ 0.05) elevation in protein-bound HHE in HPG of MCI, PCAD, and LAD subjects compared to NC subjects. No significant changes were observed in levels protein carbonyl content in any disease in the HPG. (B) Levels of protein-bound HHE and protein carbonyl content in SMTG of NC, MCI, PCAD, and LAD subjects. No significant changes were observed in either levels protein-bound HHE or protein carbonyl content in any disease stage in the SMTG. (C) Levels of protein-bound HHE and protein carbonyl content in CER of NC, MCI, PCAD and LAD subjects. No significant changes were observed in levels of protein-bound HHE or protein carbonyl content in any disease stage in the CER.