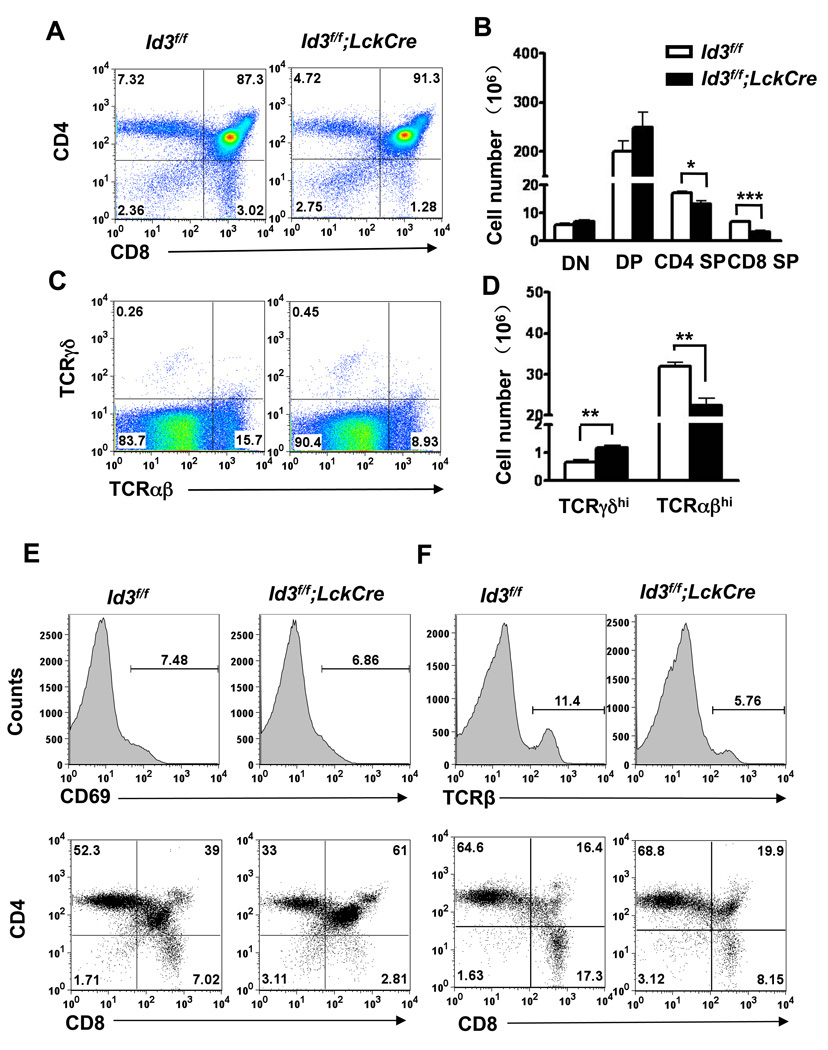
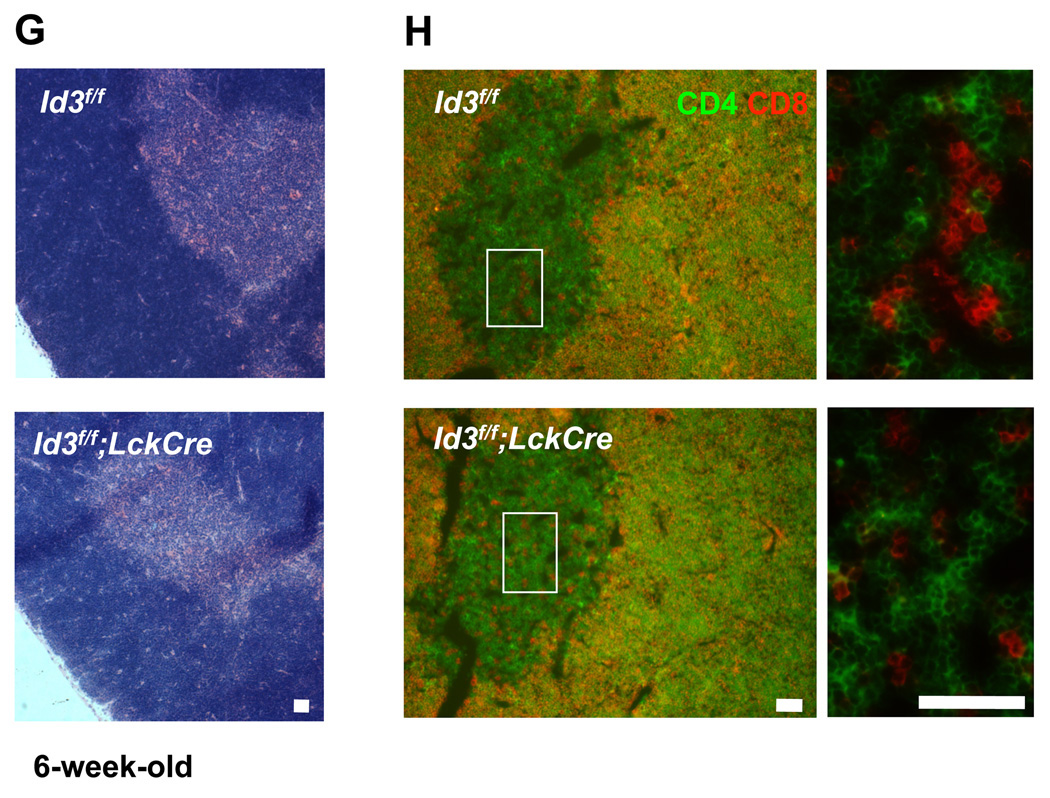
Figure 2. Disturbed γδT and αβT cell development in the thymus of Id3f/f;LckCre mice.
(A) Representative FACS analysis of αβ thymocyte development by CD4 and CD8 expression. Thymocytes were isolated from 4–6 weeks old Id3f/f;LckCre (n=3) and the Id3f/f littermate (n=4) controls. Dead cells were excluded by 7AAD staining. (B) Summary of the absolute numbers of DN (CD4−CD8−), DP (CD4+CD8+), CD4 SP (CD4+CD8−), and CD8 SP (CD4−CD8+) thymocytes. *P=0.027. ***P=0.0001. The statistical significance was assessed by unpaired student’s t test. (C) Representative FACS plots of γδ and αβ thymocyte population in Id3f/f;LckCre mice and Id3f/f mice. (D) Summary of the absolute numbers of mature γδ and αβ thymocytes. **P=0.009 (γδT cells) and 0.003 (αβT cells). The graphed results are means with SEM. (E) The CD69hi cells in total thymocytes were gated for two-D plot analysis of CD4 and CD8 expression. (F) The TCRβhi thymocytes were gated for analysis of CD4 and CD8 expression. Results of (E) and (F) were representatives of four littermate pairs. (G) H&E staining of thymus section from Id3f/f;LckCre mice and Id3f/f mice. (H) Two-color immunofluorescence analysis of thymus section with CD4 and CD8 antibodies. The green and red signals are CD4 and CD8 SP thymocytes, respectively. The yellow signals are CD4+CD8+ DP thymocytes resulting from CD4 and CD8 double staining. The enlarged views of medulla are shown on the right. Scale bar equals 50 µm.


