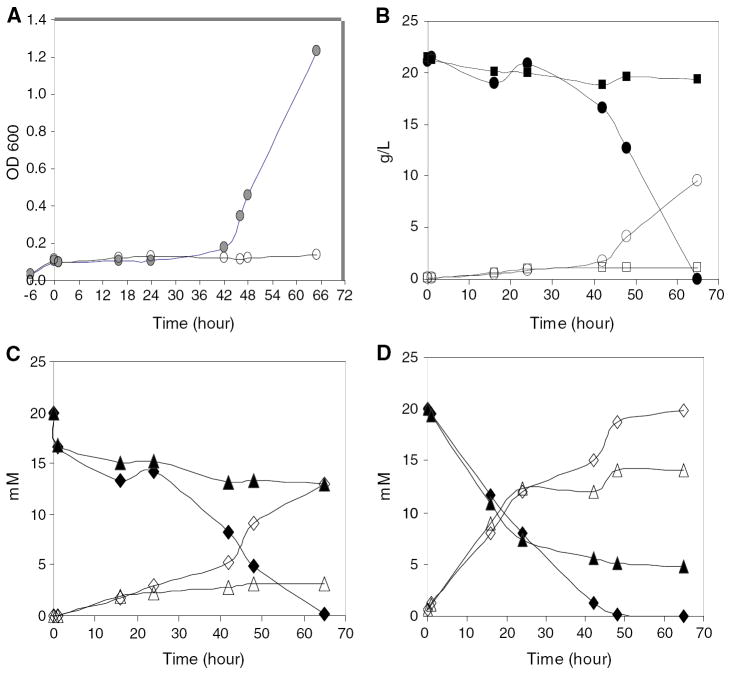
Fig. 3.
Comparison of cell growth and metabolic conversion profiles of Saccharomyces cerevisiae NRRL Y-50049 and NRRL Y-12632 over time in response to a combined inhibitor treatment of furfural and HMF at a final concentration of 20 mM each after 6 h incubation on YM medium. a Cell growth as measured by OD600 for Y-50049 (filled circle) and Y-12632 (open circle). b Glucose consumption (filled circle) and ethanol conversion (open circle) for Y-50049 versus glucose (filled square) and ethanol (open square) for Y-12632. c HMF (filled diamond) and its conversion product furandimethanol (FDM) (open diamond) for Y-50049 versus HMF (filled triangle) and FDM (open triangle) for Y-12632. d Furfural (filled diamond) and its conversion product furan methanol (FM) (open diamond) for Y-50049 versus furfural (filled triangle) and FM (Δ) for Y-12632

