
Fig. 5.
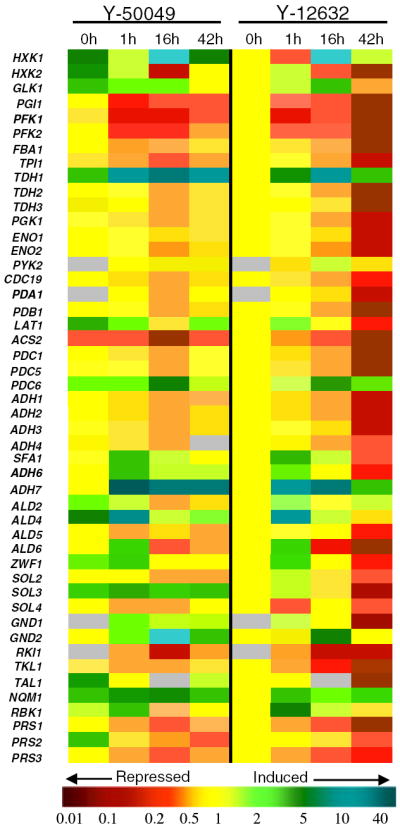
Comparison of mRNA expression for selected genes relevant in glucose metabolic pathways of Saccharomyces cerevisiae NRRL Y-50049 and NRRL Y-12632 under challenges of furfural and HMF at 20 mM each from 0 to 42 h after the treatment. Quantitative expression for each gene at each time point was expressed in fold changes against that of Y-12632 at 0 h. Yellow indicates no change; green indicates enhanced expression and red for repressed expression in quantitative scales as indicated by a color bar at the bottom. Expression data at a time point marked with gray indicate missing data or data need to be confirmed