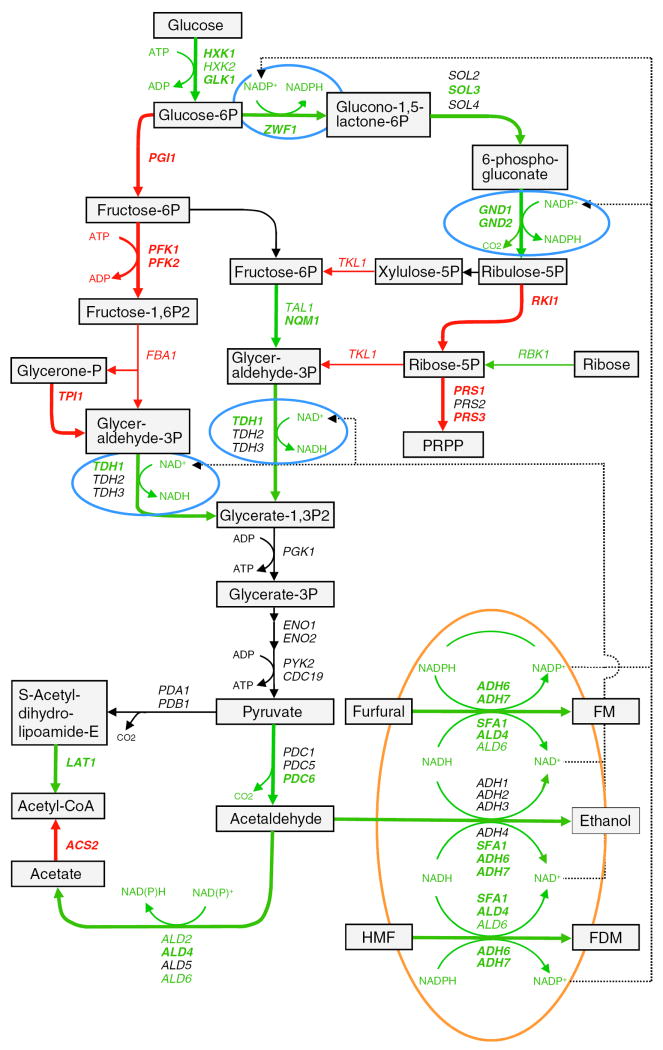
Fig. 6.
A schematic illustration of glucose metabolic pathways and conversion of furfural and HMF by tolerant Saccharomyces cerevisiae NRRL Y-50049 inferred by metabolic profiling analysis and quantitative mRNA expression analysis compared with a wild type strain NRRL Y-12632. Black arrowed lines and letters indicate normal or near normal levels of reactions, expressions or pathways, green indicates enhanced, and red for repressed expressions, reactions, or pathways. Bolded lines and letters indicate the levels of expression and pathways are statistically significant. Key steps of enhanced NAD(P)H regenerations are circled in blue and significant aldehyde reductions circled in orange

