
Fig. 7.
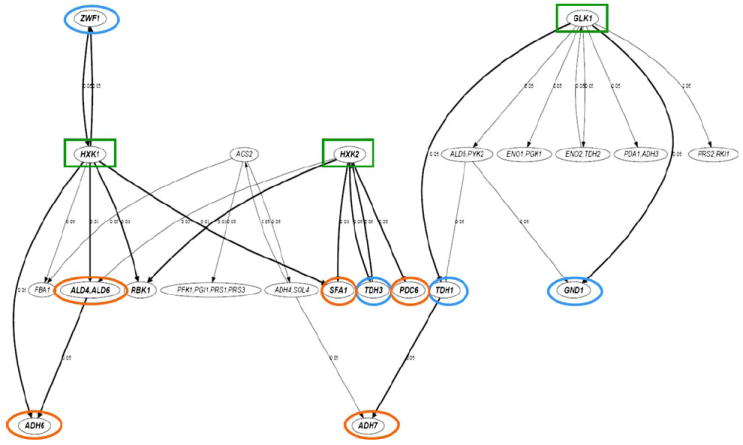
A generalized logical network model for selected genes of Saccharomyces cerevisiae NRRL Y50049 based on quantitative dynamic expression data using pathway-base qRT-PCR array analysis. The nodes in the network represent the selected genes. A node with two or more gene labels suggests that the time courses of the represented genes are highly linearly correlated and thus treated equally. The directed edges in the network indicate statistically significant (p value ≤ 0.5) nonlinear temporal associations among the genes. The p value of each interaction is shown next to the corresponding edge. Arrowed lines indicate direction of influence in an interaction. The thicker edges denote those interactions that are consistent with the proposed pathways of glucose metabolisms and detoxification of furfural and HMF. Highlighted nodes with gene names in bold font are the end points of those thicker lines that are biologically relevant. Key genes involving NAD(P)H regenerations are circled in blue and significant genes involving aldehyde reductions consistent with the reprogrammed pathways circled in orange. Three important enhanced expressed genes involving the initial step of glucose phosphorylation and energy release are boxed in green