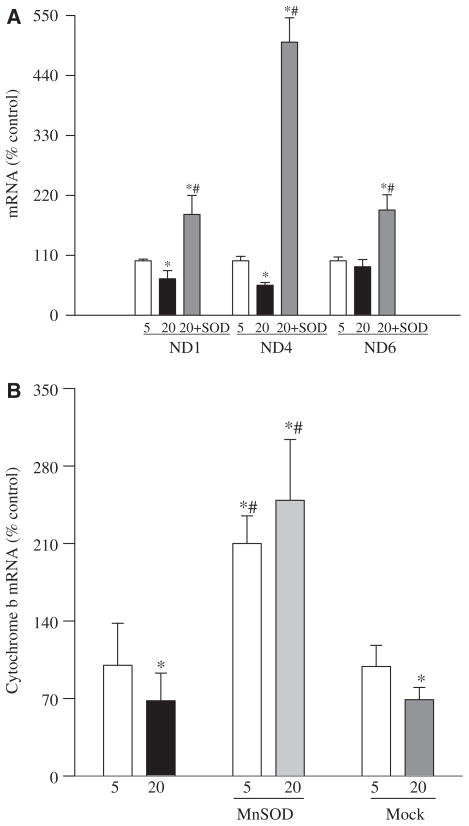
Figure 5.
Effect of glucose on altered abundance of mitochondrial-encoded genes and their protection by MnSOD: transcript abundance was assessed in DNase-treated RNA isolated from retinal endothelial cells using conventional RT-PCR for ND1, ND4 and ND6 of complex I (A) and Cyt b of complex III (B) using the primers provided in Table I. Relative mRNA abundance was quantified using Un-Scan-It Gel digitizing software and the values in the figures are presented as mean band intensity of the target gene normalized by the intensity of β-actin. The values obtained from the un-transfected cells incubated in 5 mM glucose are considered 100% (control). Each measurement was made in four or more different cell preparations. *p < 0.05 compared to control, #p < 0.05 compared to 20 mM glucose alone.

