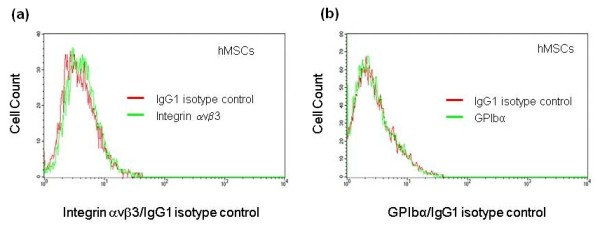
Figure 3.

Expression of αVβ3 integrin and platelet glycoprotein Ibα on the surface of hMSCs. (a and b) Show the results of flow cytometric analysis of integrin αvβ3 ((a), green histogram) and platelet glycoprotein Ibα (GPIb, (b), green histogram) expression on the surface of hMSCs. Red histograms represent fluorochrome matching isotype controls.
