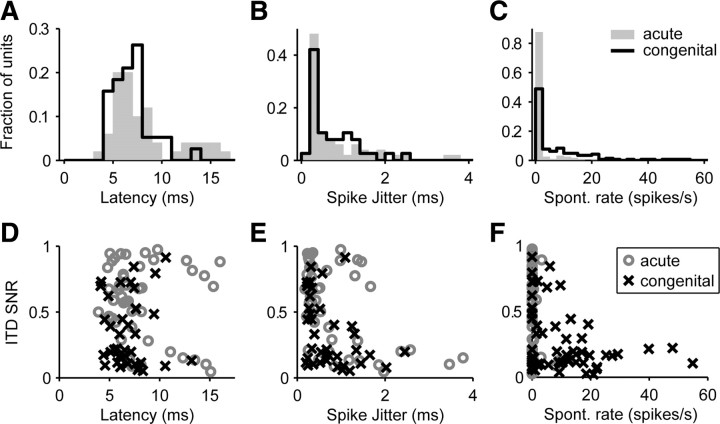
Figure 6.
Effect of congenital deafness on spontaneous rate and spike timing. A–C, Histograms comparing the distributions of mean spike latency (A), latency jitter (B), and spontaneous discharge rates (C) between acutely deafened and congenitally deaf cats. Latencies and jitter are shown for early responses only. D–F, Scatter plots of ITD SNR against mean spike latency (D), latency jitter (E), and spontaneous rate (F) for the two samples of IC neurons.

