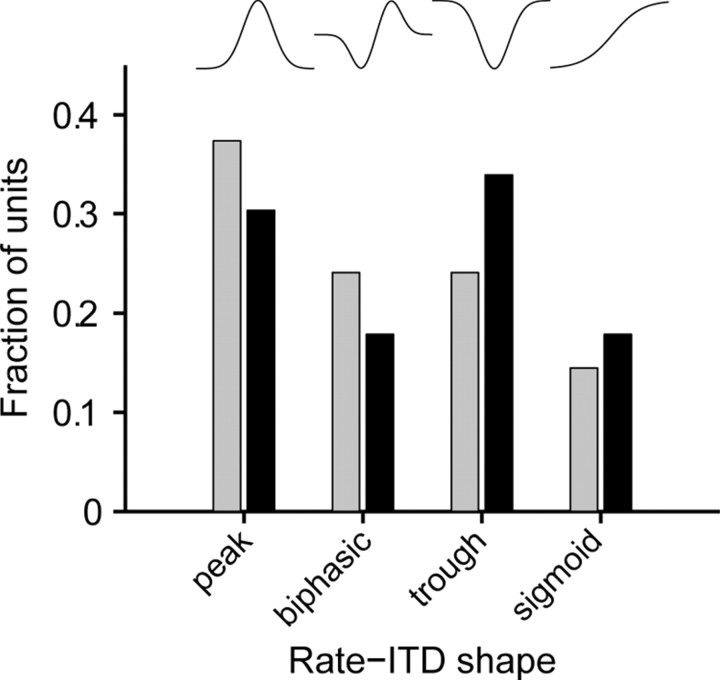
Figure 7.
Shapes of rate–ITD curves do not differ between acutely deafened and congenitally deaf cats. Histograms show incidence of rate–ITD curve shapes based on the four templates (top) of Smith and Delgutte (2007). Analysis limited to IC neurons with statistically significant ITD SNRs.

