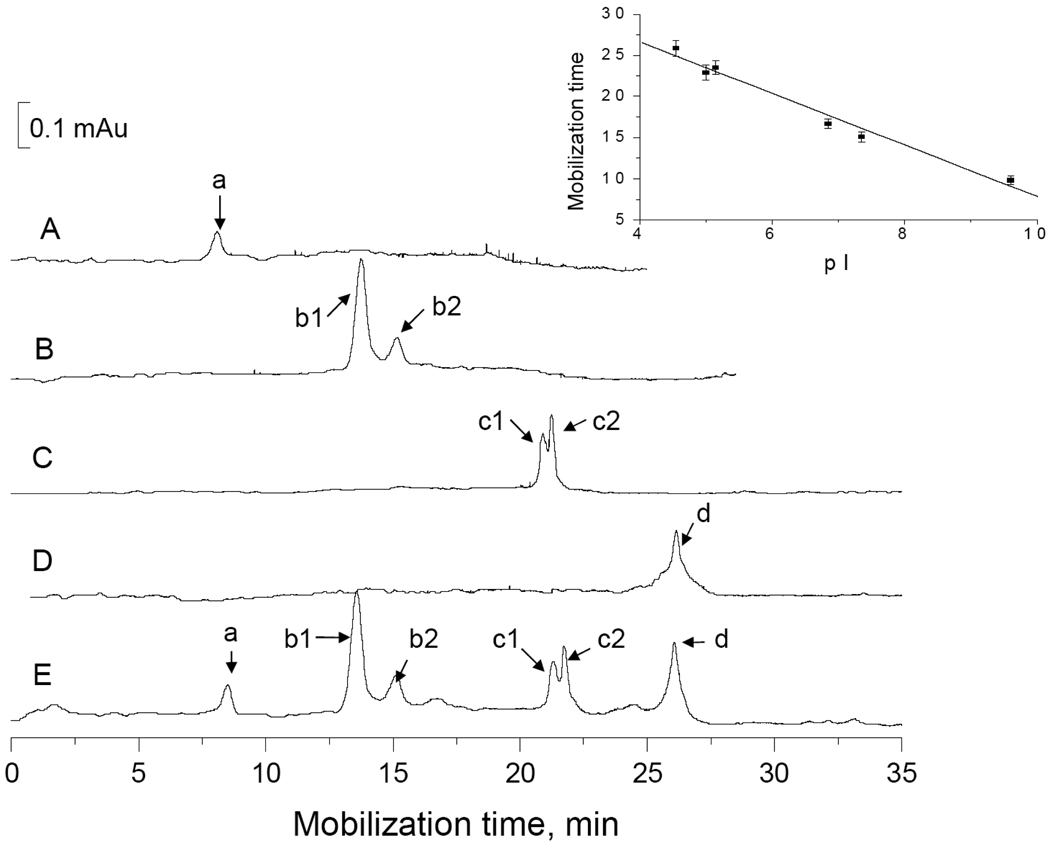
Figure 5. CIEF and mobilization of standard proteins.
The CIEF separations were performed in a cross-linked polyacrylamide coated capillary (60 cm long × 150 µm i.d. × 375 µm o.d.) with a focusing medium containing 0.9% Pharmalyte, 2% CHAPS and 0.5 mM ammonia acetate. The mobilized proteins were monitored using an absorbance detector at 280 nm. Traces A–D were obtained from individual proteins, and trace E was obtained from a mixture of all these proteins. The inset shows the linear relationship between mobilization time and pI value.

