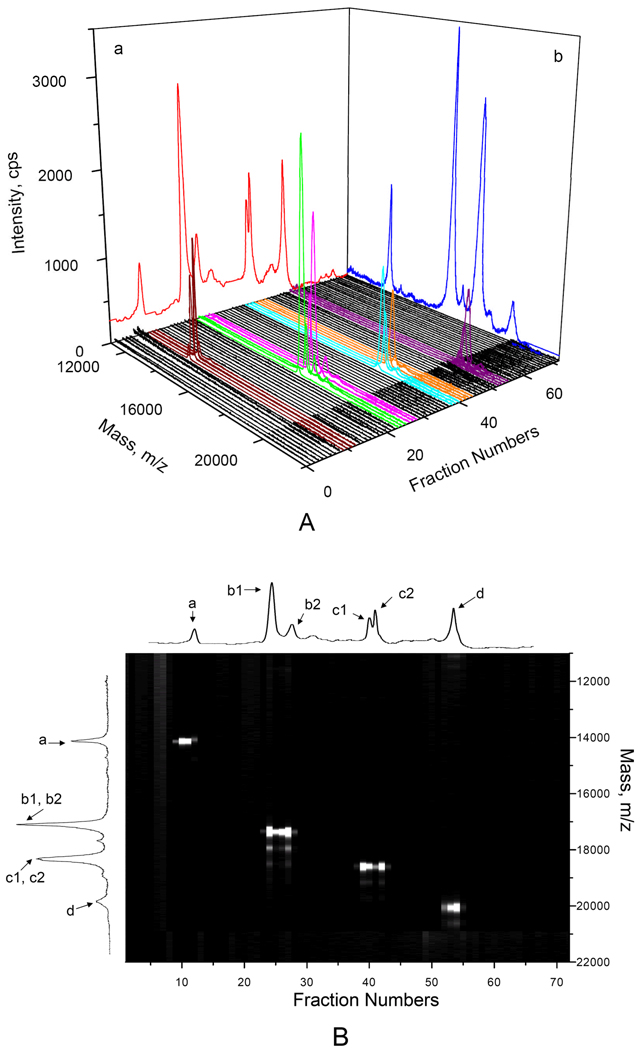
Figure 6. Two-dimensional (CIEF-MALDI-MS) separation of standard proteins.
The sample contained 0.05 µg/µL ribonuclease A (peak a), 0.0065 µg/µL horse myoglobin (peaks b1 and b2), 0.003 µg/µL β-lactoglobulin B & A (peaks c1 and c2) and 0.05 µg/µL soybean trypsin inhibitor (peak d). The CIEF separation results with UV absorbance detection (the trace in plane a of Figure 6A and the trace at the very top of Figure 6B) was obtained following the procedure as described in Figure 5. The MS spectrum of the standard protein mixture (the trace in plane b of Figure 6A and the trace on the left side of Figure 6B) was obtained using proteins without additives. All other spectra were obtained following the procedure as described in Figure 3, with detection at the central region. Figure 6A presents the CIEF-MALDI-MS data in a 3-dimensional format, while Figure 6B represents the identical set of data as a 2-dimensional image.

