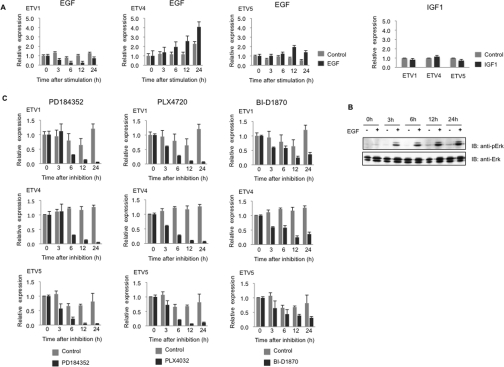
Figure 1. Effect of EGF, PD184352 and capicúa knockdown on expression of ETV1, ETV4 and ETV5 mRNAs in BRAF(V600E) SKMEL13 and/or wild-type PMWK melanoma cells.
(A) qRT-PCR of ETV1, ETV4 and ETV5 mRNA from PMWK cells stimulated with EGF (100 ng/ml) for the number of hours indicated (black bars), IGF1 (50 ng/ml) for 24 h (black bars) and with no stimulus (grey bars). Gene expression is normalized relative to the internal control gene B2M, assigning a value of 1.0 for the zero time point with no stimulus. Values are means±S.D. (four different sets of analyses for each data point). (B) Western blot of whole-cell lysate of PMWK cells stimulated with EGF for the times indicated, and immunoblotted with the antibodies indicated to monitor the phosphorylation status of ERK. (C) The effect of the ERK pathway inhibitor PD184352 (2 μM, [30]), BRAF(V600E) inhibitor PLX4720 (10 μM, [31]) and p90RSK inhibitor BI-D1870 (10 μM, [32]) on expression of ETV1, ETV4 and ETV5 in SKMEL13 cells at the times indicated in hours (black bars). Data for cells with no inhibitor are shown as grey bars. Gene expression is normalized to the internal control gene B2M, assigning a value of 1.0 for the zero time point with no inhibitor. Values are the means±S.D. (four different sets of analyses for each data point).

