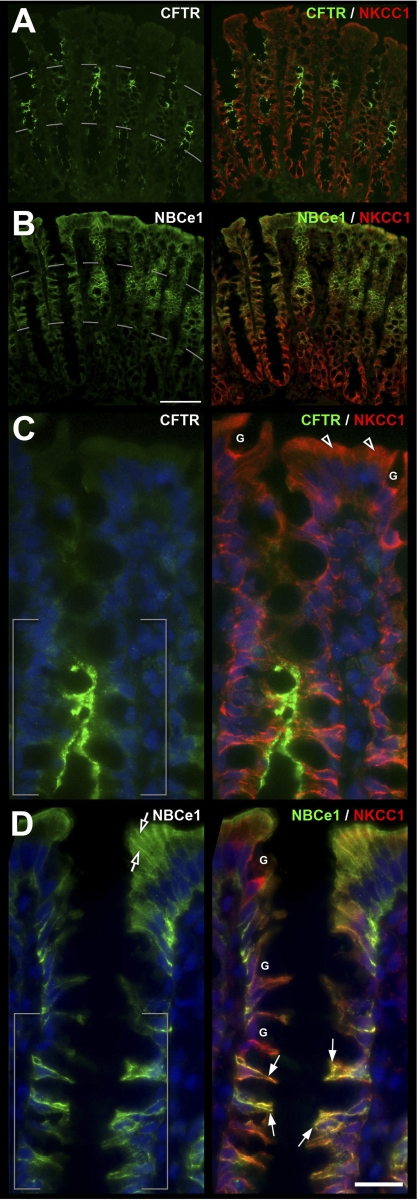
Fig. 8.
CFTR, NBCe1, and NKCC1 distribution in the proximal colon. A and B: low-magnification images of the crypt-surface epithelium double labeled for CFTR (green) or NBCe1 (green) and NKCC1 (red) shows gradients of expression. C and D: higher-magnification image of the upper two-thirds of crypt and surface epithelium shows distribution of CFTR, NBCe1, and NKCC1 in enterocytes (arrows) juxtaposed to NKCC1 expressing goblet cells (G). CFTR (C) and NBCe1 (D) appear coexpressed in the middle third crypt region (brackets). NKCC1 (open arrowheads) and NBCe1 (open arrows) staining in the upper third of the crypt and surface epithelium Scale bar: A and B: 100 μm; C and D: 25 μm.

