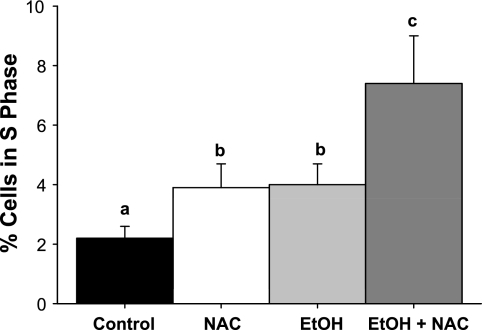
Fig. 7.
Quantitation of liver cells in S phase in rats fed high-fat diets via TEN (Control), fed control diets supplemented with 1.7 g·kg−1·day−1 NAC, fed isocaloric diets with EtOH at 12 g·kg−1·day−1, or fed EtOH diet + 1.7 g·kg−1·day−1 NAC as described in materials and methods, based on cell counting after PCNA staining. Data are means ± SE, % cells in S phase. Bars with different letters differ P < 0.05 by 2-way ANOVA followed by Student-Newman-Keuls post hoc analysis for multiple pairwise comparisons.

