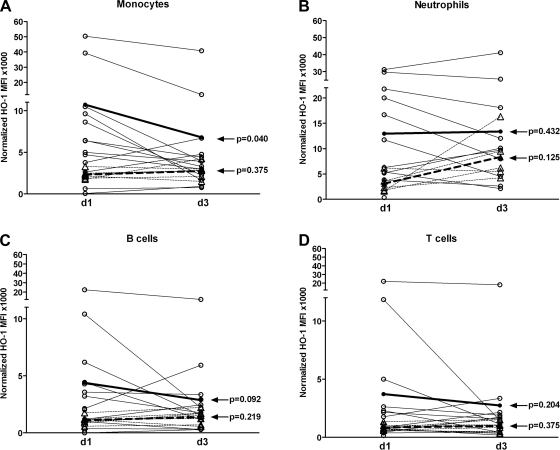
Fig. 2.
Leukocyte subset expression of HO-1 over time. PBMCs were obtained from VC and AP patients on day 1 (d1) and day 3 (d3) and stained for leukocyte surface markers and intracellular HO-1. The cells were then analyzed by FACS and corrected for isotype control antibody and normalized by use of Spherotech beads to allow comparison between individuals and over time. Samples from VC are shown in broken lines with mean values shown in bold broken bold line; samples from AP are shown in solid lines with mean values shown in bold solid line. Statistical analysis (day 1 vs. day 3) was based on the Wilcoxon's signed-rank test. A: monocytes. B: neutrophils. C: B cells. D: T cells.

