
Figure 1.
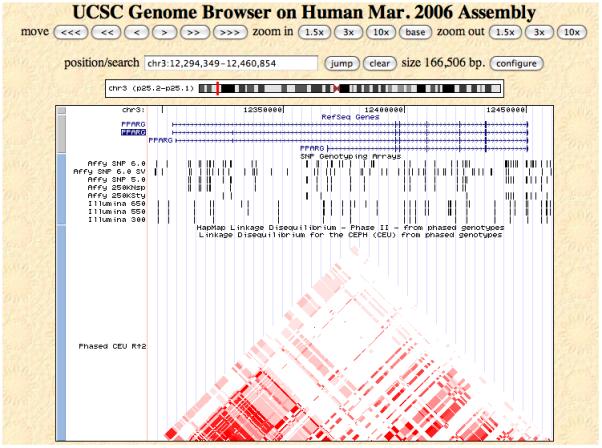
View of the candidate genomic region around PPARG using the UCSC genome browser. The plot shows the different versions of the candidate gene and the LD structure in the region as measured in r2 for the CEU HapMap sample.
Official websites use .gov
A
.gov website belongs to an official
government organization in the United States.
Secure .gov websites use HTTPS
A lock (
) or https:// means you've safely
connected to the .gov website. Share sensitive
information only on official, secure websites.
View of the candidate genomic region around PPARG using the UCSC genome browser. The plot shows the different versions of the candidate gene and the LD structure in the region as measured in r2 for the CEU HapMap sample.