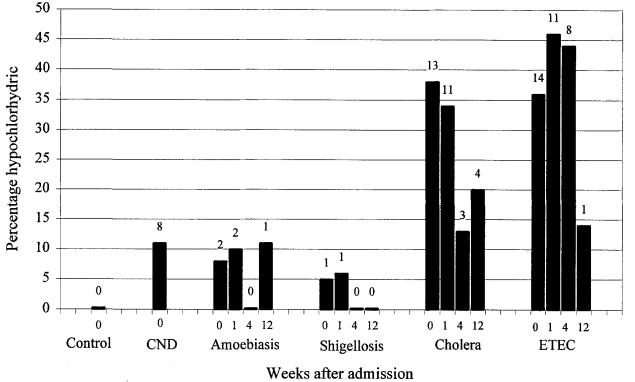
Fig. 2.
Percentage of patients who were hypochlorhydric on admission (week 0) and 1,4 and 12 weeks later. The number of hypochlorhydric patients is shown above each bar. The number of patients studied at each time is shown in Fig. 1. Patients with culture-negative diarrhoea (CND) were studied only on admission. Hypochlorhydria was defined as stimulated gastric acid less than 5 mmol/h. etec: enterotoxigenic E. coli; Control: data from healthy controls given by Sack et al. (1972) are plotted for comparison.

