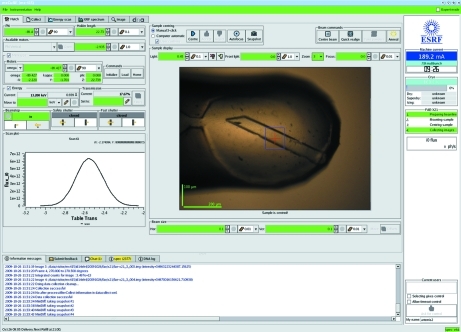
Figure 2.
The Hutch tab of the MxCuBE GUI. Expert mode is accessed by clicking the check box in the top right of the GUI. The plot window shows a scan of beam intensity versus horizontal translation of the experiment table carried out as part of the ‘quick realign’ procedure. The image-viewing brick shows a sample after centring in the X-ray beam (blue square) using the 3-click option.

