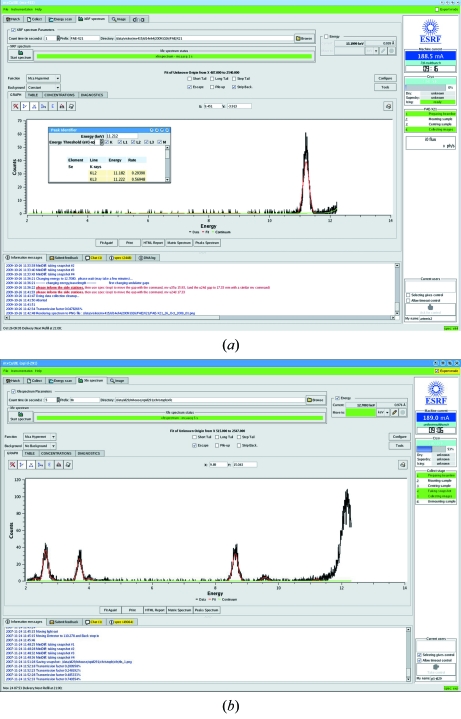
Figure 5.
Analysis of X-ray-induced fluorescence (XRF) spectra in MxCuBE. (a) The spectrum from a crystal (see Fig. 2 ▶) of a selenomethionyl derivative of the feruloyl esterase module of xylanase 10B from Clostridium thermocellum (Tarbouriech et al., 2005 ▶). The displayed spectrum is truncated so that peaks owing to Compton and Rayleigh scattering by the sample of the incident X-ray beam are not shown. Clicking on a peak in the spectrum allows identification of elements via a pop-up window. (b) The XRF spectrum from a crystal of thermolysin from Bacillus thermoproteolyticus (Mueller-Dieckmann et al., 2007 ▶) showing the presence of chloride (Kα emission line, ∼2.6 keV), potassium (Kα, Kβ emission lines, ∼3.7 keV and ∼4.0 keV, respectively) and zinc (Kα, Kβ emission lines, ∼8.6 keV and ∼9.6 keV, respectively). The peak at ∼12.2 keV is due to Compton scattering by the sample of the incident X-ray beam. The Kα emission line of sulfur (∼2.3 keV) is also visible in this spectrum.

