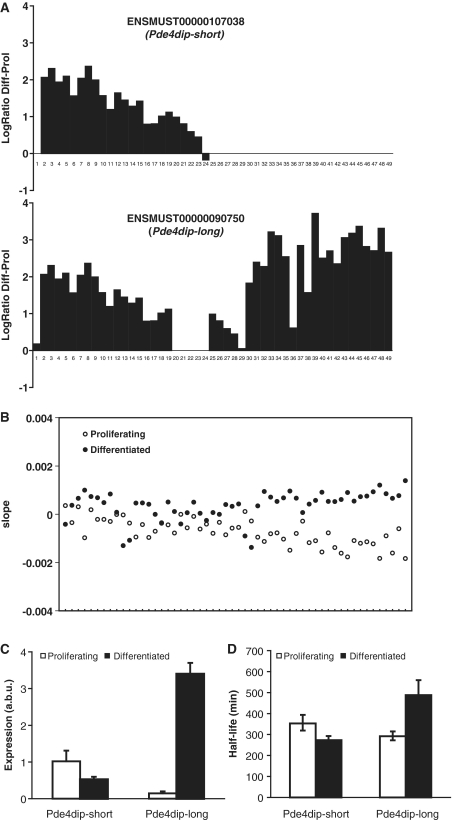
Figure 5.
Association between RNA degradation and alternative splicing in Pde4dip. (A) Exon structure of the Pde4dip-short and the Pde4dip-long mRNA and the natural logarithm of the ratio (y-axis) of the expression levels of the different exons (x-axis) between differentiated and proliferating cells, as assayed before actinomycin D treatment. Note: using CAGE-seq (cap analysis gene of expression analyzed by high-throughput sequencing, investigating transcription start sites) data, we found that the annotation of the first exon from ENSMUST00000090750 in ENSEMBL is incorrect (20), explaining its aberrant behavior. (B) Plot of the decay rates in differentiated (closed symbols) and proliferating (open symbols) cells for the different probe sets in the Pde4dip gene, ordered from 5′ to the 3′ end of the gene. Less stable parts of the RNA have more negative slopes. (C) Relative abundance (arbitrary units; a.b.u) of the short and long transcripts of the Pde4dip gene, as assayed by qPCR with primers in the two different 3′-UTRs. (D) Estimated half lives of the short and long transcripts of the Pde4dip gene, as assayed by qPCR with primers in the two different 3′-UTRs. Error bars reflect standard error of the mean.

