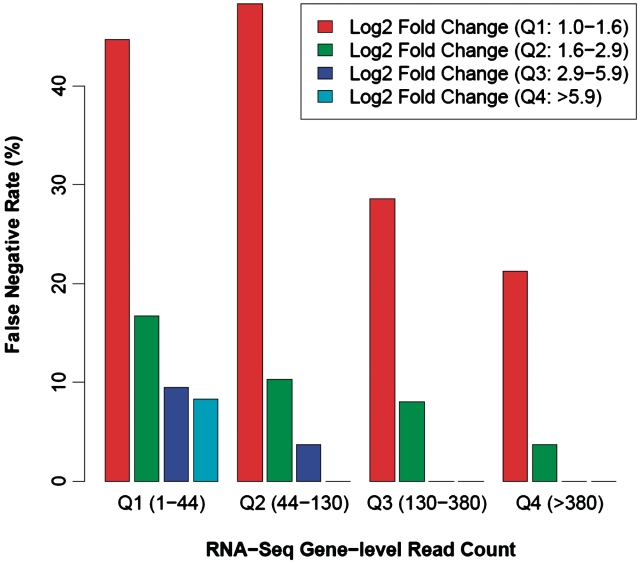
Figure 4.
The ability of RNA-Seq to identify significant DEGs is positively associated with both the number of sequences per gene and the extent of expression change. Based on the TaqMan qPCR estimates of expression fold-change (FC) between the MAQC human UHR and brain samples, we grouped the 510 qPCR DEGs into four quartiles: first quartile, log2 FC between 1 and 1.6; second quartile, 1.6–2.9; third quartile, 2.9–5.9 and fourth quartile, >5.9. Similarly, we grouped the 510 qPCR DEGs into four quartiles based on the maximum gene-level RNA-Seq read count in the human UHR and brain samples: first quartile, read count 1–44; second quartile, 44–130; third quartile, 130–380 and fourth quartile, >380. For each fold-change group, we calculated the proportion of TaqMan qPCR DEGs missed by RNA-Seq (i.e. RNA-Seq false-negative rate) in individual RNA-Seq read count groups, as shown in the barchart.

