Figure 2.
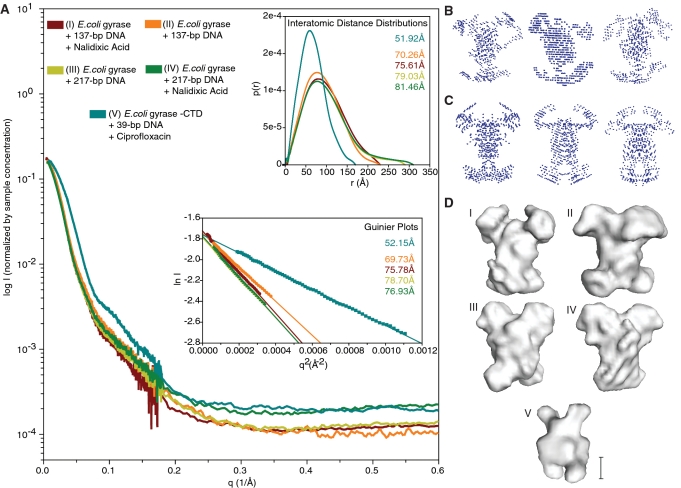
Small-angle X-ray scattering data and envelope modeling. (A) Normalized experimental SAXS curves of all final DNA-bound complexes that were used for further analysis. The horizontal and vertical axes correspond to q, the momentum transfer, and to the logarithm of the scattering intensity (arbitrary units). The lower left inset shows Guiner plots and RG values calculated from the final data sets using q ranges reported by AutoRg and Primus. The horizontal and vertical axis correspond to q2 (Å−2) and the log of the scattering intensity. The solid symbols indicate the q range used to determine RG. The upper right inset shows the pairwise distribution functions P(r) and RG values calculated from the final data sets. The horizontal and vertical axes correspond to the radius (Å) and to the calculated P(r). The curves in all three plots are colored coded according to the complex analyzed as indicated by the key at the top of panel A. Representative (B) P1 and (C) P2 bead models built by DAMMIN (39) calculated using data from samples of gyrase bound to a 137-bp DNA fragment in the presence of nalidixic acid. The best models from the calculations were averaged to build SAXS envelopes (40). (D) SAXS envelopes for five different DNA-bound gyrase complexes. Envelopes I-IV correspond to the complexes of E. coli gyrase with (I) 137-bp DNA fragment and nalidixic acid, (II) 137-bp DNA fragment without nalidixic acid, (III) 217-bp DNA fragment without nalidixic acid, (IV) 217-bp DNA fragment with nalidixic acid. Envelope V corresponds to an E. coli gyrase GyrA-ΔCTD truncation mutant bound to a 39-bp DNA fragment in the presence of ciprofloxacin, a potent quinolone. Note the same overall shape with four protruding domains amongst all envelopes calculated using the intact protein. The CTD truncated sample (V) forms a significantly smaller complex. The scale bar corresponds to ∼50 Å.

