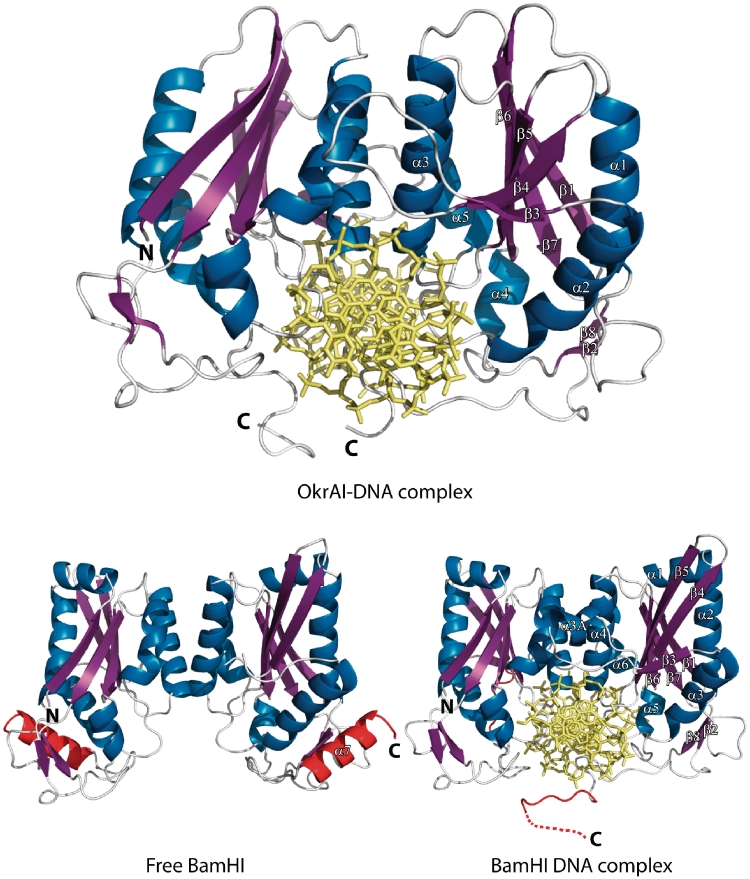
Figure 1.
Schematic representation of the OkrAI–DNA complex (top), the apo form of BamHI (bottom left) and the BamHI–DNA complex (bottom). The secondary structural elements of the R subunit in each complex are labeled and are colored as follows: α helices are blue, β strands are magenta and loops are white. The BamHI C terminus that is α helical in the apo form and unstructured in the DNA bound form is highlighted in red.

