Figure 5.
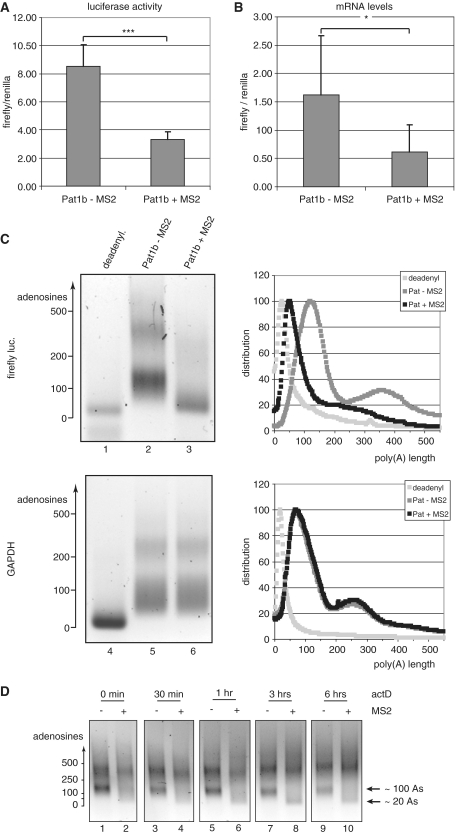
Pat1b down-regulates the expression of target genes by inducing deadenylation and destabilization of the mRNAs. COS-7 cells were co-transfected with a firefly luciferase construct containing MS2-binding sites, Renilla luciferase control and either GFP-Pat1b or GFP-MS2-Pat1b. (A) The ratio of firefly to Renilla luciferases in arbitrary units, with the error bar indicating the standard deviation. ***P < 0.001 in Student’s t-test. (B) The abundance of the firefly mRNA relative to the Renilla reporter, as determined by qPCR, with the error bar indicating the standard deviation. *P < 0.05 in Student’s t-test. The left panels of (C) show the poly(A) tests of the firefly luciferase (lanes 1–3) and of the endogenous GAPDH mRNA (lanes 4–6). The sample analyzed in lanes 2 and 5 stemmed from cells transfected with GFP-Pat1b, in lanes 3 and 6 from cells expressing GFP-MS2-Pat1b. In lanes 1 and 4, the RNA was artificially deadenylated by RNaseH digestion in the presence of oligo(dT). The length of the poly(A) tail, as estimated from the migration of DNA markers, is indicated on the left panels. The profiles of lanes 1, 4 are shown in light gray, lanes 2, 5 in dark gray, and 3, 6 in black. The ordinate axes report arbitrary units of intensity, which was normalized for fragment length in order to reflect molar distribution. (D) Time course of the poly(A) decay. Transfected cells were treated with actinomycin D (5 µg/ml) for the indicated times, total mRNA was isolated, and the poly(A) length of the firefly luciferase mRNAs was determined as in 5C. The mRNA populations containing tails of ∼20 and 100 adenosines, respectively, are indicated on the right.

