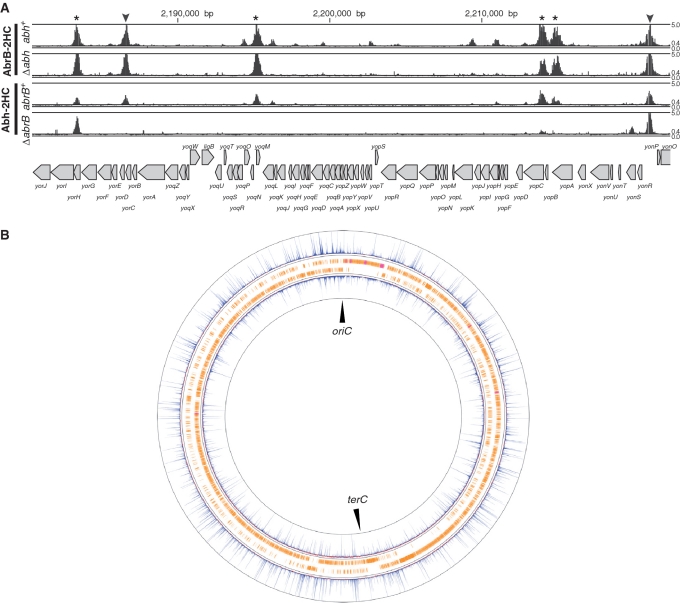
Figure 2.
AbrB and Abh binding signals on the B. subtilis genome. (A) Distribution of AbrB binding signals in the abh+ and Δabh backgrounds, and Abh binding signals in abrB+ and ΔabrB backgrounds, in the 2 180 000 bp to 2 222 000 bp region of the genome, are shown. Protein-binding signals for each probe in the region are indicated alongside the genomic coordinates. The top and bottom lines in each column indicate signal intensities of 5 and 0, respectively. The middle line shows the threshold values used to define AbrB and Abh binding peaks (0.4). The gene organization is schematically shown at the bottom. Protein-binding sites located in intergenic regions and coding regions are indicated using triangles and asterisks, respectively. (B) Distributions of AbrB (outer) and Abh (inner) binding signals over the entire genome. Clockwise and counter-clockwise ORFs are schematically indicated.

