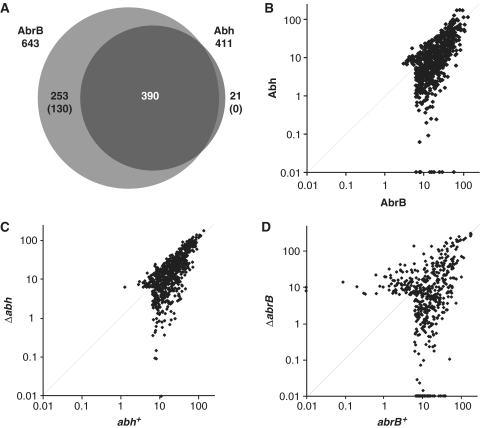
Figure 3.
Comparison of AbrB and Abh-binding signals in various strains. (A) A Venn diagram of overlapping binding sites for AbrB and Abh in a wild-type background. The numbers in parentheses indicate the levels of confidence associated with the identification of particular AbrB- and Abh-specific binding sites (please see main text). (B) A log-scale scatter plot of the binding intensities of AbrB (x-axis) and Abh (y-axis) in 664 PBRs in a wild-type background. (C) A log-scale scatter plot of AbrB binding intensities in abh+ (x-axis) and Δabh (y-axis) cells. (D) A log-scale scatter plot of Abh binding intensities in abrB+ (x-axis) and ΔabrB (y-axis) cells.

