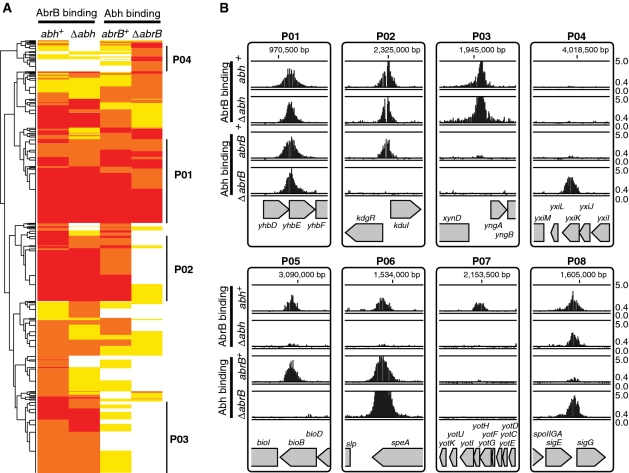
Figure 4.
Classification of PBRs according to AbrB and Abh binding profiles. (A) A cluster diagram of 753 PBRs based on AbrB-binding intensities (in various classes) in abh+ and Δabh backgrounds, and Abh-binding classes in abrB+ and ΔabrB backgrounds. The VL, L, M and H classes of AbrB/Abh binding are indicated in white, yellow, orange and red, respectively. Clusters containing PBRs belonging to the four major binding profiles of the selected unambiguous PBRs summarized in Table 1 are marked by bold lines at the right of the diagram. (B) Typical examples of AbrB and Abh binding signals in PBRs belonging to classes P01–P08. The binding signals are shown as in Figure 2A. Gene organizations around selected PBRs are indicated at the bottom of each panel.

