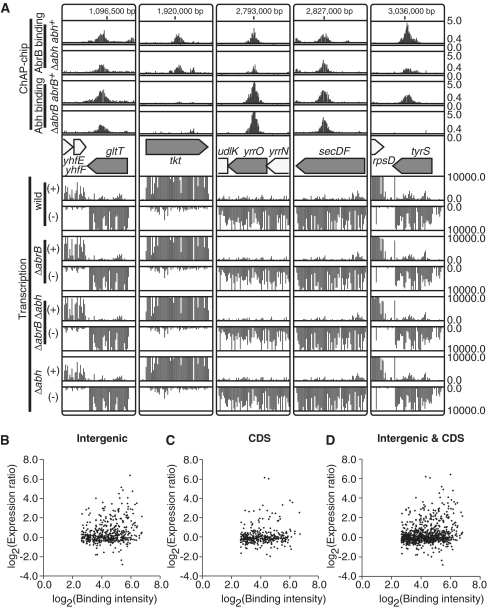
Figure 7.
AbrB/Abh binding to actively transcribed regions. (A) Examples of AbrB/Abh binding to coding regions of highly transcribed genes are shown. The AbrB/Abh binding profiles in four strains are depicted as in Figure 2A. The gene organization of selected regions is indicated in the middle. Below the gene map, transcriptional signals (y-axis) of each probe in the selected regions are presented separately for Watson (+) and Crick (–) strands. (B) A scatter plot of log2 binding intensity values of AbrB to intergenic regions (x-axis) and log2 expression ratios of downstream genes in ΔabrB cells compared to those in wild-type cells (y-axis). If AbrB bound to the intergenic region of divergently transcribed genes, we plotted the expression ratios of both genes. (C) Scatter plot of log2 binding intensity values of AbrB to coding regions (x-axis) and log2 expression ratios of AbrB-bound genes in ΔabrB cells compared to those in wild-type cells (y-axis). (D) The results shown in (B) and (C) are merged.

