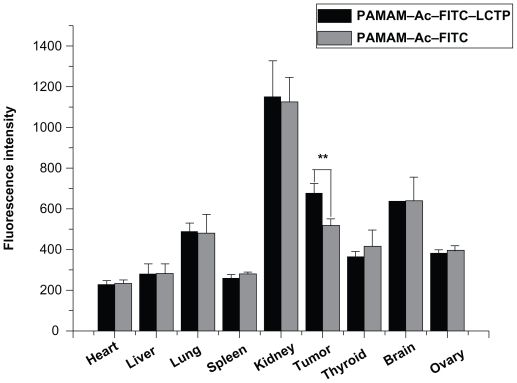
Figure 6.
Distribution of fluorescence-labeled acetylated polyamidoamine and fluorescence-labeled acetylated polyamidoamine lung cancer targeting peptide 4 hours postinjection in athymic mice bearing nonsmall cell lung cancer tumor xenografts, the relative fluorescence intensity per unit area data are presented as mean ± standard deviation (n = 6, **P < 0.01 fluorescence-labeled acetylated polyamidoamine lung cancer targeting peptide versus fluorescence-labeled acetylated polyamidoamine in tumor).

