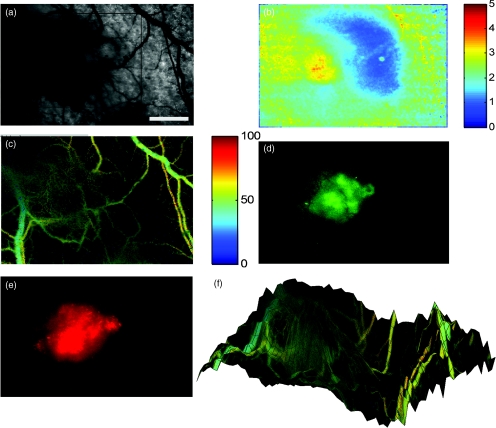
Figure 3.
(a) Bright field, (b) oxygen tension in the percent of oxygen, (c) hemoglobin oxygen saturation, (d) GFP-HIF-1 fluorescence, and (e) constitutively expressed RFP fluorescence are shown. The hemoglobin saturation (c) is shown with percent oxygen saturation on a color scale, whose brightness is modulated by the total hemoglobin content (thus, well-vascularized regions appear brighter). Also in (f), a combined plot shows the hemoglobin oxygen saturation plotted as in (c), with a 3-D projection of the tissue oxygenation shown on the vertical axis. The tumor is seen predominantly within the black box. These images were acquired toward the end of the imaging sequence (t = 55 min). Images are approximately 5 × 3.7 mm, with a 1-mm scale bar seen in (a).

