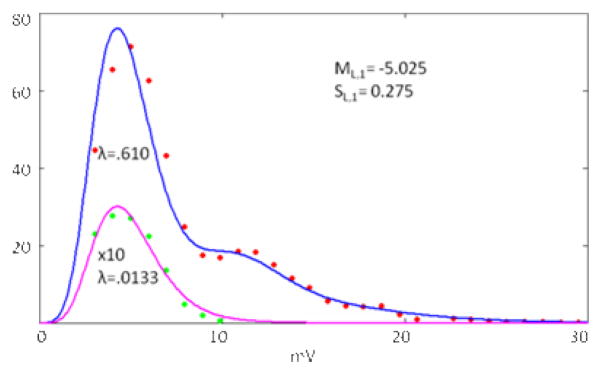
Figure 6.
Peak voltage distributions for two incident photon fluxes. The solid lines are the best fit theoretical Poisson weighted sum of lognormal distributions with parameters determined from single photon voltage distributions. The green points and pink line are rescaled by a factor of ten for visualization.

