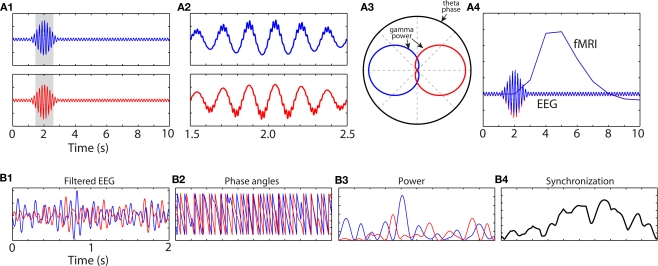
Figure 4.
Simulated data showing how information may be contained in the fine temporal landscape of M/EEG data, and how that information might go undetected using more temporally coarse methods such as fMRI. (A1) An increase in theta-band oscillation power peaking at 2 s is not different between conditions “blue” and “red.” However, close inspection of the grayed areas reveals cross-frequency coupling (A2) such that gamma power is concentrated at different theta phase regions between the conditions (A3). (A4) shows the predicted hemodynamic response (red and blue lines are overlapping). (B1) Bandpass filtered EEG data from two channels, and (B2) their phase angle time series. (B3) shows band-specific power at each site; note that inter-channel synchronization (B4) does not occur at times of increased power at either site, showing the independence of local activity (B3) and network synchronization (B4).

