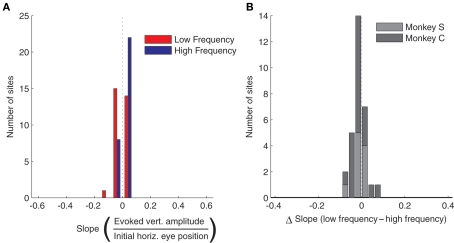
Figure 4.
Population analysis of the effect of horizontal initial eye position on vertical saccade amplitude. (A) Magnitude of slopes obtained from linear regression of vertical saccade amplitude vs. horizontal initial eye position for each stimulation site. Data are shown for low (red) and high (blue) frequency stimulation conditions. The horizontal axis has been scaled to match Figure 3A for comparison purposes. (B) Differences in slope between low and high frequency conditions. Horizontal axis has been scaled to match Figure 3B.

