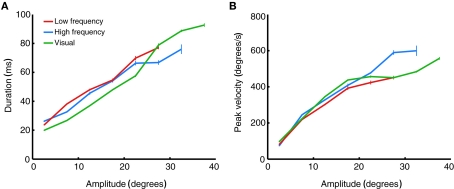
Figure 9.
Main sequence relations of evoked saccades. (A) Saccade duration as a function of saccade amplitude, binned in 5° bins. Data are averaged over all stimulation- (red and blue) or target- (green) evoked saccades in all stimulation sites, regardless of fixation position. Error bars indicate ±1 SEM. (B) Saccade peak velocity as a function of saccade amplitude. Same saccades and conventions as in (A).

