
Table 1.
Simulation scenarios for all eight cases
| Case | Scenario | True predictors | True response (L) | P (L = 1) | Predictor |
|---|---|---|---|---|---|
| noise (π) | |||||
| 1 | Predictor noise |  |
L1 = (Z4∧Z5)ν(Z5∧Z11) | 0.3750 | 0.05 |
| 2 | 0.3750 | 0.15 | |||
| 3 | Model complexity |  |
L1 = (Z4∧Z5) ν (Z5∧Z11) | 0.09375 | 0.05 |
| 4 | 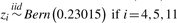 |
0.09375 | 0.15 | ||
| 5 | L2 = (Z4∧Z5∧Z21∧!Z45)ν | 0.10156 | 0.05 | ||
 |
(Z5∧Z11∧Z21∧!Z45)ν | ||||
| 6 | (Z5∧Z16∧Z21∧Z33∧!Z45) | 0.10156 | 0.15 | ||
| 7 | Latent predictora | 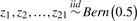 |
L3 = (Z4∧Z5) ν (Z5∧Z11∧Z21) | 0.3125 | 0.025 |
| 8 | L4 = (Z4∧Z5∧Z21) ν (Z5∧Z11∧Z21) | 0.1875 | 0.025 |
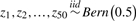
For the latent predictor scenarioa, Z21 represents a latent predictor and is not observed in the data used to construct LR, logicFS, and LF models.