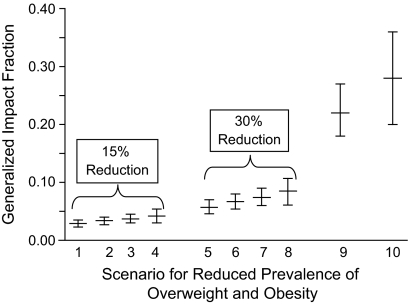
Figure 1.
The median generalized impact fraction and attributable fraction (with 2.5%–97.5% simulation intervals) derived from 10,000 bootstrap data sets using the case-load weighted-sum method, given 10 scenarios of reduced prevalence of obesity and overweight, Atherosclerosis Risk in Communities Study, 1987–2003. Scenarios for the reduced prevalence of overweight and obesity are as follows: 1) 15% reduction in obesity, shift obese to overweight; 2) 15% reduction in obesity, shift obese to normal weight; 3) 15% reduction in obesity and overweight, shift down 1 category; 4) 15% reduction in obesity and overweight, down to normal weight; 5) 30% reduction in obesity, shift obese to overweight; 6) 30% reduction in obesity, shift obese to normal weight; 7) 30% reduction in obesity and overweight, shift down 1 category; 8) 30% reduction in obesity and overweight, shift to normal weight; 9) attributable fraction, complete elimination of obesity; 10) attributable fraction, complete elimination of obesity and overweight. Bars, 95% simulation interval.

