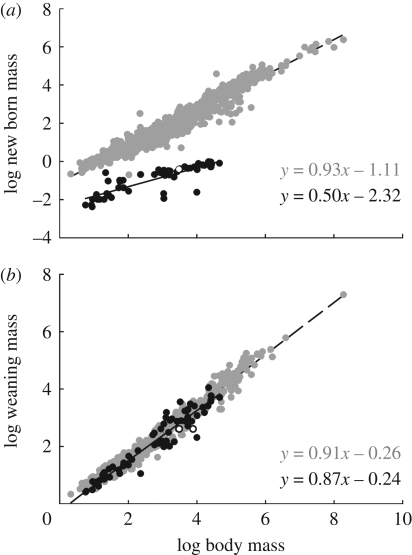
Figure 2.
Bivariate log–log plots of offspring body mass (a) at birth and (b) newly weaned as a function of adult mass in grams. All logs are log-base 10, all mass units are grams and the figure legend is the same for all figures. Filled grey circles, placental; dashed lines, placental OLS; filled black circles, marsupial; solid lines, marsupial OLS; open circles, monotreme.

